Table of Contents
The Overlays module

The overlays module allows you to visualise the output of tracking and post-processing in the context of the raw images that form your dataset. This allows you to visually verify the accuracy of your data processing, and can also provide novel insights into spatial and temporal structure in your dataset.
Upon clicking the Overlays button on the home panel, you will be presented with the following GUI:
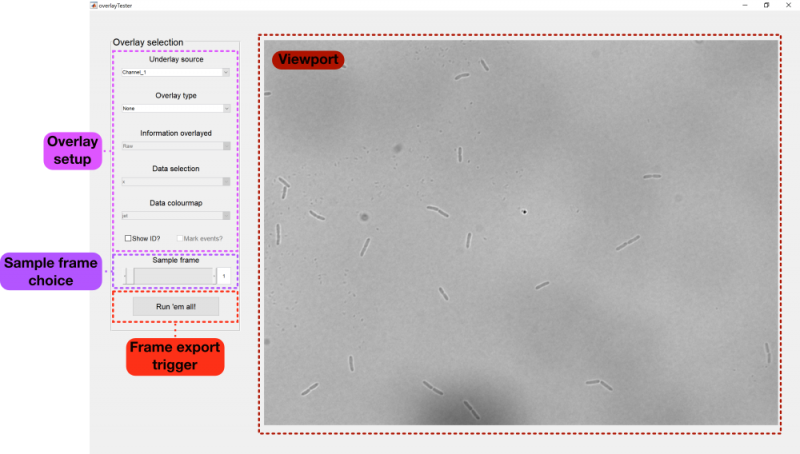
The viewport lets you see how the current overlay settings look when applied to a single frame. Clicking Run 'em all! will then apply these settings to all the frames in your dataset, saving them in a new directory from which they can be loaded and turned into a movie.
Setting up the overlays
The main overlay settings are contained in five drop-down menus:
- Underlay source: Allows selection of the grayscale images that will form the base of the overlay. Can be any of the input channels, or the segmentation.
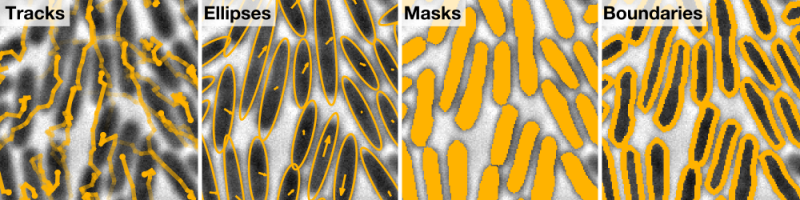
- Overlay type: Allows you to choose one of four different types of overlays:
- Tracks: Draws a line that follows the path of the object, starting from the beginning of the track and ending at the current timepoint. The opacity of the line increases the closer to the current timepoint it gets.
- Ellipses: Draws an ellipse over each object, using the object length and width measurements to specify the major and minor semiaxes. Also displays an arrow at the centre of each object, indicating its instantaneous direction of motion.
- Masks: Draws the segmentation of each object over each object.
- Boundaries: Draws the outline of the segmentation of each object around each object. This allows viewing of internal structures in the objects.
- Information overlaid: When an overlay is selected, this menu allows you to choose how each element in the overlay should be coloured:
- Raw: All elements will be coloured the same way (orange).
- Track IDs: Each element will be coloured according to its associated track ID. Colours are chosen randomly upon initialisation of the GUI.
- Data: Each element will be coloured according to a specified data field
- Data selection: With Data chosen in the Information overlaid menu, this menu allows you to specify the source of the data that should be shown. The options available are all track-associated data fields, including any externally defined data fields. For more details on how to add your own options to this menu, please refer to the advanced usage page.
- Data colourmap: Once you have chosen a data field to display, this menu allows you to specify the colourmap that should be used to assign colours to each element of the overlay.
In addition to these menus, two checkboxes are available at the bottom of the settings panel: Show ID? and Mark events?. With Show ID selected, a small label will appear next to each object containing its track ID. Mark events? allows you to display externally defined events. For further details on how to assign events, please see the advanced usage page.
Converting from frames to a movie
Once you are happy with the setup of the overlay, click Run 'em all! to apply these settings to all the frames in the dataset. When this has finished, you will be able to access the set of generated frames in the new 'Overlays' folder in the root directory. You can now generate movies from these frames. There are many ways to do this, but two example methods are described below.
Method 1: Using ImageJ/FIJI
FIJI provides a number of utilities for producing movies. A simple method for generating .AVIs is described below.
- Go to File → Import → Image Sequence, then navigate to the 'Overlays' directory in the file selection dialogue that appears. Open a frame of the movie.
- A dialogue will now appear, allowing you to specify parameters of the data import (e.g. the total length of the movie, the format images should be imported as). For coloured overlays it is recommended that you check the Convert to RGB box, as failing to do so can result in the movie being imported in grayscale.
- You should now see an image stack containing your movie. This can now be saved as a .AVI by going to File → Save As → AVI… and selecting the relevant playback options.
Further details of the image sequence import method can be found in this Youtube tutorial.
Once you have generated a basic .AVI, tools such as FFmpeg can be used to compress the movie or convert it to a different format.
Method 2: Using Quicktime Pro
Movies can also be exported using Quicktime Pro, allowing the user to take advantage of Quicktime's built-in export system to natively generate many different movie formats.
- Go to File → Open image sequence (or press Ctrl+Shft+O) and navigate to the overlays directory in the file selection dialogue that appears. Choose a frame from your movie and open it.
- A window should now appear containing your movie. To save it using the format of your choice, simply go to File → Export (or press Ctrl+E) and select your chosen format under the 'Export' drop-down menu.
Example outputs
The above steps can be combined to give a wide range of different outputs. Below are some examples of the types of movie that can be generated using the overlay system.
Track reconstruction
In this movie, the tracks of cells within a high-density 2D system are reconstructed and overlayed on top of the original phase-contrast images. Track sections are coloured according to the time between the start of the track and the time the section was measured, varying between 0 (cyan) to 100 seconds (magenta), the total length of the movie:
Lineage tracking
In this movie, separate lineages assigned using division detection are indicated with different coloured outlines. Track IDs are also shown:
The 'generational age' of each cell in this dataset is also automatically calculated in the division detection module. In this video, generated using the special 'Lineage trees' option, cell ages are indicated by the colour of the overlying track, starting from generation 1 (dark blue) and finishing at generation 6 (dark red).