labelStartAndEndFluoCells.m
Class: Script
Dependancies: meanintinellipse.m
Description: Takes in the procTracks data structure and a pair of fluorescence images, one taken at the beginning of the timeseries and one at the end. By only taking two fluorescence images, you can associate each of your tracks with a fluorescence-based population without causing excess phototoxicity or photobleaching.
Fluorescent tracks are assigned to population 2. Non-fluorescent tracks are assigned to population 1. Tracks that cannot be assigned to either (as they overlap with neither the first timepoint nor the final timepoint) are assigned to population 3.
Author: Oliver J. Meacock
- labelStartAndEndFluoCells.m
%Classifies FAST tracks according to the fluoresence intensity measured in
%an initial and a final frame.
%
%Author: Oliver J. Meacock

clear all
close all

Root = 'D:\pilG_YFP_WT_CFP_Low_Density_Coculture';
trackLoc = [Root,filesep,'Tracks.mat']; %Location of your Tracks .mat file (containing procTracks)
startImgLoc = [Root,filesep,'PreSnap_YFP.tif']; %Location of the fluorescence image you took prior to timecourse imaging
endImgLoc = [Root,filesep,'PostSnap_YFP.tif']; %Location of the fluorescence image you took after timecourse imaging

load(trackLoc,'procTracks','trackSettings')

imgInfo = imfinfo(startImgLoc);
pixelSize = 1/imgInfo.XResolution; %As some upsampling may have occured during FAST processing, best to use resolution of fluoresence image

prePlane = double(imread(startImgLoc,'Index',1));
postPlane = double(imread(endImgLoc,'Index',1));

meanFluo = nan(size(procTracks,2),1);

%For each track...
for i = 1:length(procTracks)
    %If this track is present at the initial timepoint
    if procTracks(i).times(1) == 1
        [meanFluo(i),~] = meanIntInEllipse(prePlane,procTracks(i),1,pixelSize);
    elseif procTracks(i).times(end) == trackSettings.maxF
        [meanFluo(i),~] = meanIntInEllipse(postPlane,procTracks(i),size(procTracks(i).times,1),pixelSize);
    end
end

%Fit Gaussian mixture model of average intensities within ellipses to
%find threshold to split fluorescent from non-fluorescent cells
model = fitgmdist(meanFluo,2);
idx = cluster(model,meanFluo);

for i = 1:length(procTracks)
    if isnan(idx(i))
        procTracks(i).population = 3;
    elseif idx(i) == 1
        procTracks(i).population = 1;
    elseif idx(i) == 2
        procTracks(i).population = 2;
    end
end

save(trackLoc,'procTracks','-append')
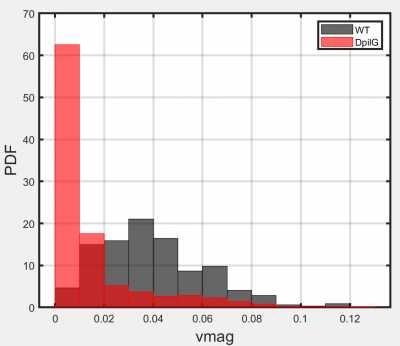
Example output: Plot generated in the plotting module, showing how fluorescence can be used to separate a high motility (black) from a low-motility (red) genotype when mixed in a single system.