labelThresholdEvents.m
Class: Function
Description: Takes in the procTracks data structure and detects events based on the times at which the values of a user-specified field rise above (or drops below) a user-specified threshold. Applies a refractory period, preventing new events from being detected before the given quantity drops below (or rises above) a second user-specified threshold. This can help to suppress spurious events that result from noisy data.
Author: Oliver J. Meacock
- labelThresholdEvents.m
function procTracks = labelThresholdEvents(procTracks,tgtPop,tgtField,startThresh,endThresh,eventLabel)
%LABELTHRESHOLDEVENTS labels times at which a given track-associated
%quantity either goes above or below a given threshold with an integer
%label.
%
%   INPUTS:
%       -procTracks: Track data output by the tracking module.
%       -tgtPop: If population assignment has been performed, this variable
%       can be used to specify which of the populations you wish to
%       restrict event detection to. Can be left empty if you wish to apply
%       it to all tracks.
%       -tgtField: String defining the name of the field of procTracks you
%       wish to apply threshold detection to. Can refer to any field,
%       provided it is indexed by time and is one-dimensional (so 'x' and
%       'vmag' are permissible, but 'start' and 'length' are not).
%       -startThresh: The value of the track-associated data that needs to
%       be breached for an event to be detected. Track then enters a
%       'refractory' state, where the value needs to drop above/below
%       endThresh for a new event to be detected.
%       -endThresh: Defines the value at which the track-associated
%       quantity is released from its refractory state. If endThresh >
%       startThresh, it is assumed that an event starts when the given data
%       drops below startThresh and that the refractory period ends when it
%       rises above endThresh. If endThresh < startThresh, the opposite is
%       true.
%       -eventLabel: The integer you wish to use to label this set of
%       events.
%
%   OUTPUTS:
%       -procTracks: Equal to the input procTracks, but either with the
%       'event' field updated, or (if not already present) added, with the
%       appropriate events marked.
%
%   Author: Oliver J. Meacock, (c) 2020

if startThresh >= endThresh
    transType = 'up'; %Events are when you go from low to high
elseif startThresh < endThresh
    transType = 'down'; %Events are when you go from high to low
else
    error('Thresholds do not appear to be numerical.')
end

%Needed to ensure you don't overwrite pre-existing event data in procTracks
%later
if isfield(procTracks,'event')
    preFlag = true;
else
    preFlag = false;
end

for i = 1:size(procTracks,2)
    currList = procTracks(i).(tgtField);

    if preFlag
        currEvt = procTracks(i).event; %Get pre-existing event list for this track (if it exists)
    else
        currEvt = zeros(size(procTracks(i).x)); %Want to make sure we're using the maximal possible length of the event list (need to avoid using e.g. vmag, which is one shorter than maximum as it is from a differential).
    end

    %Want to do processing only if the tgtPop variable is empty OR there is
    %a target population, the population field exists, and the current
    %track is part of the target population
    if isempty(tgtPop)
        proceed = true;
    elseif ~isempty(tgtPop) && isfield(procTracks,'population')
        if procTracks(i).population == tgtPop
            proceed = true;
        else
            proceed = false;
        end
    elseif ~isempty(tgtPop) && ~isfield(procTracks,'population')
        warning('Population specified, but field not present in procTracks. Proceeding without splitting by population...')
        proceed = true;
    end

    if proceed
        currInd = 1;
        refState = false; %Whether you are in the refractory period or not

        switch transType
            case 'up'
                evtSwitch = find(diff(currList > startThresh) == 1);
                refSwitch = find(diff(currList < endThresh) == 1);
            case 'down'
                evtSwitch = find(diff(currList < startThresh) == 1);
                refSwitch = find(diff(currList > endThresh) == 1);
        end

        evtList = [];
        while proceed %I.e. while there are still events to test
            futureEvts = [0,evtSwitch' > currInd];
            futureRefs = [0,refSwitch' > currInd];

            if ~refState && sum(futureEvts) > 0 %If event is permitted, detect next and switch to refractory state
                currInd = evtSwitch(diff(futureEvts) == 1);
                evtList = [evtList;currInd];
                refState = true;

                if sum(refSwitch' > currInd) == 0
                    proceed = false;
                end
            elseif refState && sum(futureRefs) > 0 %If event is not permitted, detect next refractory period end and switch to 'excitable' state
                currInd = refSwitch(diff(futureRefs) == 1);
                refState = false;

                if sum(evtSwitch' > currInd) == 0
                    proceed = false;
                end
            else
                proceed = false;
            end
        end

        currEvt(evtList+1) = eventLabel;
    end
    procTracks(i).event = currEvt;
end
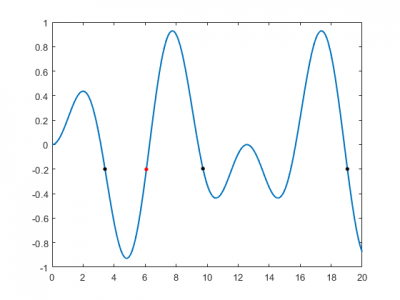
Example usage:
%Make some artificial data with multiple peaks of different heights
dt = 0.01;
t = 0:dt:20;
y = sin(x).*sin(x/4);

procTracks(1).times = round(t/dt);
procTracks(1).y = y;

%Detect event class 1 when y rises above -0.2 (must drop below -0.6 for
%subsequent detections)
procTracks = labelThresholdEvents(procTracks,[],'y',-0.2,-0.6,1);

%Detect event class 2 when y drops below -0.2 (must rise above 0.05 for
%subsequent detections
procTracks = labelThresholdEvents(procTracks,[],'y',-0.2,0.05,2);

%Plot results
plot(procTracks.times*dt,procTracks.y,'LineWidth',1.5)

hold on

%Red dots indicate events of class 1
plot(procTracks.times(procTracks(1).event == 1)*dt,y(procTracks(1).event == 1),'r.','MarkerSize',12)

%Black dots indicate events of class 2
plot(procTracks.times(procTracks(1).event == 2)*dt,y(procTracks(1).event == 2),'k.','MarkerSize',12)
Example output: