SplitFluoPopulationsTracks.m
Class: Function
Description: Takes in the procTracks data structure and two manually specified channel indices, and splits tracks based on the ratio of fluorescence in the two channels. Assumes that there are two populations in the dataset, each labelled in a separate channel.
Author: Oliver J. Meacock
- SplitFluoPopulationsTracks.m
function procTracks = SplitFluoPopulationsTracks(procTracks,chan1Ind,chan2Ind)
%SPLITFLUOPOPULATIONSTRACKS automatically splits tracks into separate
%populations based on the ratio between the fluorescence levels in the
%indicated channels.
%
%   INPUTS:
%       -procTracks: The output from the tracking module of FAST. Stored in
%       the 'Tracks.mat' file.
%       -chan1Ind, chan2Ind: Indicies of the two channels that will be used
%       to split your populations. For example, if one population is
%       labelled with GFP (channel 1) and the second is labelled with RFP
%       (channel 3), chan1Ind = 1 and chan2Ind = 3.
%
%   OUTPUTS:
%       -procTracks: Same as the input variable procTracks, but with a new
%       field ('population') indicating which of the two populations each
%       track belongs to.
%
%   Author: Oliver J. Meacock, (c) 2019

chan1str = ['channel_',num2str(chan1Ind),'_mean'];
chan2str = ['channel_',num2str(chan2Ind),'_mean'];

meanChan1Vals = arrayfun(@(x)(nanmean(x.(chan1str))),procTracks);
meanChan2Vals = arrayfun(@(x)(nanmean(x.(chan2str))),procTracks);

fluoRats = meanChan1Vals./meanChan2Vals;
logFluoRats = log(fluoRats)'; %Make distribution linear and symmetrical about 0

model = fitgmdist(logFluoRats,2); %Mixed Gaussian model of log fluorescence ratio
idx = cluster(model,logFluoRats);

for i = 1:size(procTracks,2)
    procTracks(i).population = idx(i);
end
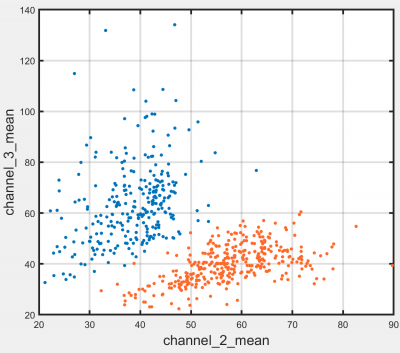
Example output: Plot generated in the plotting module, showing how the two fluorescence channels are split into two separately labelled clusters:
